

Why a thermal camera survey?
Sometimes condensation can look like rising damp. Experienced and qualified surveyors use a range of tools and skills to determine this. One of the tool used by us is the Thermal Imaging camera and electronic hygrometer.
Here is a video showing these tools being used together on a thermal camera survey. This method visibly highlights sections of a bedroom wall, where condensation is happening in real time.
To do this, our surveyor first needs to set up the hygrometer, to measure the relative humidity in the room and obtain the air temperature. This information is used to calculate the ‘dew point’. The dew point is simply the temperature at which the air in the room will reach saturation. This happens at 100%RH. This of course means the air can no longer support more water vapour and condensate (water) will appear. This will happen on plaster, wood, clothes, furniture or, anything else which is at or below this ‘dew point’.
This is a certainty; condensation will always happen on surfaces at and below dew point.
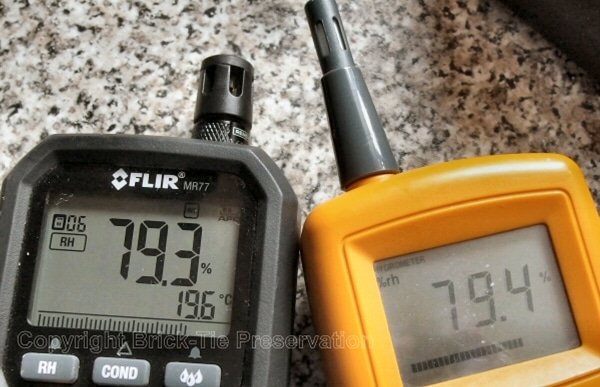
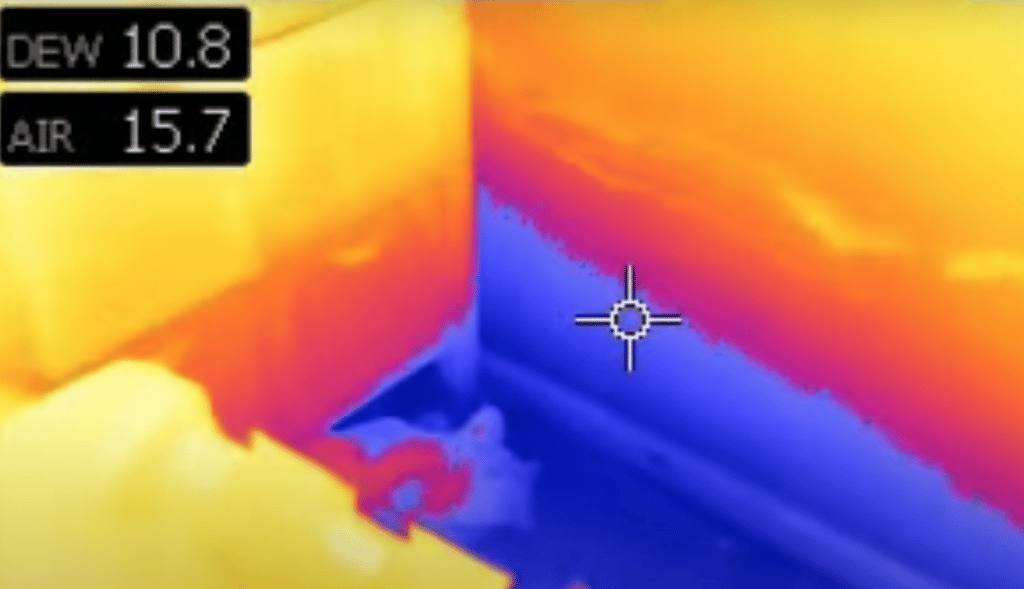
The hygrometer (A Flir MR77 in this case) has done what a thermal camera cannot; it has measured the environmental condition of the air. So why use a thermal camera? Well, our surveyor has established that the dew point of the air in the room, near the damp wall, is just under 15C. The dew point temperature is lower at just under 11C. That’s a 4C difference. In other words the air will need to be cooled by 4C before the RH% rises to 100% and condensate is deposited. So there shouldn’t be a problem with condensation should there?
Read on to see why there is one and, how a thermal camera (A Flir 420bx) helps us show our client (in this case a social housing provider), that this is the case.
What’s happening?
The walls show visual evidence of damp at low level. This is a ‘spare’ room, rarely used and, as a result the tenant doesn’t heat it much. It is used as a store for all their spare bric-a-brac such as books, DVDs, CD’s and clothes. These are usually stored around the external perimeter of the room. On arrival our surveyor has pulled these away from the walls in some places, to see what’s going on.
What is happening when condensation forms and how does a thermal camera survey help?
Experience tells us that the surface temperature of walls is primarily governed by the air temperature inside the house. If the air is not heated much the walls will be colder. However, air circulates in a ‘convection’ current. It is normal for internal corners and edges of walls, especially at low level, to be a little colder. This is because the warm air in effect ‘cuts’ the corner and leaves it cold. If furniture or something else, is placed at this point, then that effect is amplified and the wall; shielded from the meager warmth held in the circulating air, will become much colder.
Localised surface temperature measurements can be used to check the temperature and find out if these are near or below dew point. We’ve done this for decades and it works well as a tool; simply using a spot measurement Infra Red temperature sensor. However, this is slow and requires lots of record taking to write down all of the readings. These than need transposing to a photograph or drawing. This is where the thermal camera comes into its own.
Remember vapour pressure!
Furniture and stored articles may shield part of a wall from air flow and heat, but they are not insulated from water vapour. Water vapour moves through still air (it’s actually over excited water molecules), and will always get around and through obstacles. So there will be just as much actual water vapour supported in the air next to the walls, behind the items, as there is in the adjacent bedroom – only the air temperature is reduced. This increases the relative humidity towards dew point.
Before using the thermal camera it is important to input the dew point temperature into the thermal camera so that it ‘knows’ what to look for. The combination of the MR77 and 420bx makes this a snip, as they connect via Bluetooth using FLIRs ‘MeterLink’ technology. This is why the data displayed in the above video (top left of the frame), is dynamic. Where ‘MeterLink’ is not available the data can be added manually, but of course conditions can and do vary in buildings, so it may need adjusting as the survey progresses.
Then the surveyor adjusts for the thermal emissivity of the surfaces to be checked and finds the reflected radiation coming from them, rather than that being emitted by them (the Tref). This enables the surveyor to find out the actual surface temperatures of the surfaces in a quantitative way. Without the emissivity and Tref factored in, the thermal image temperatures are only apparent temperatures; qualitative readings. Qualitative readings are not suitable for thermography, where environmental measurements are involved.

Once the above is complete the camera can be used to view all of the suspect surfaces. The surface temperatures are shows on the screen in the video as the ‘spot’ reading. This is accurate now that the emissivity and reflectivity are known. The surveyor can see at a glance that the lower portion of the wall is well below dew point, as is the solid floor near to it. Condensation is happening in real time on these surfaces, because the air in the ‘boundary’ layer near the wall will be at 100%RH. You can think of the boundary layer as the air cuddled up to the wall and in temperature equilibrium with the surface. A kind of localised micro-climate, behind the sofa if you will (this is our good friend Ross Charters CSRT of Complete Preservation’s term, so we’ve pinched it with his permission).
Read on for further information or call our qualified and expert surveyors now on Leeds 265 2752 York 566577 or Sheffield 224 5121 or email us via our contact page
Thermal camera surveys for maximum credibility
One feature of high end cameras is the ability to create a custom palette on the camera screen. This is a manipulation of the colours the camera displays for radiation gradients. As this is a quantitative inspection, these gradients can be referred to as temperature gradients. The palette in the video has been customised to show any area at or below dew point in a vivid and solid blue. This is known as using an isotherm to highlight an anomaly in a thermogram. The video demonstrates this, however Flir’s excellent ‘Flir Tools’ also allows the thermographer to do this ‘post survey’ back at the lab or office. In fact the palettes can be changes and various tools used to get the most from the thermograms obtained on site.
The thermal camera takes over 40,000 measurement per frame to build the picture you see on the video; each pixel is a direct reflection of the temperature of the surface. Imagine taking 40,000 single temperature measurements with a point and shoot single pixel IR thermometer? Far better to ask for one of our qualified surveyors to carry out a thermal camera survey.
The video is a demonstration of some of the technology available to refine damp diagnosis and help clients get the best results from any remedial work we specify. In this case the survey also included the use of electronic moisture meters and deep wall probes, to see what was happening below the surface of the wall. It also included a full survey of the house, which required the testing of the mechanical ventilation in the bathroom and kitchen, using a calibrated anemometer. This is crucial, where indoor air quality and condensation issues are present. A thermal camera survey is about much more than just waving a thermal imager around.

The answer to damp, mould and unhealthy living.
In addition, what did the use of the thermal camera bring to our client? It helped us to find out what was really happening, but it also gave the social housing owner the information they needed to address their tenants’ concerns. The tenant was convinced that the house had ‘rising damp’. Who can blame them, the base of the walls were wet and there was a visible ‘tide mark’ a foot or two up the walls? It looked like rising damp and the landlord thought so too. The video was recorded to provide an easy to understand graphical example of our findings. This is a great aid to communication and reinforces the credibility of our findings for tenants and landlord alike. Their prayers were answered and a solution found.
The survey was carried out by our senior surveyor and Technical Director Bryan Hindle CSRT CSSW AIOSH, who is a Category 1 thermographer (see ISO 18436-7). All our surveyors are trained and regularly tested by Bryan, on their knowledge and skills in thermography. Their surveying techniques and methodologies are constantly reviewed too. Why not join us on a surveyor training day such as this one?
Our damp diagnosis, ventilation and indoor air quality surveys are carried out all over Yorkshire. Why not call our qualified and expert surveyors now on Leeds 265 2752 York 566577 or Sheffield 224 5121 or email us via our contact page
Our thermal camera surveys are used to find damaged or missing cavity wall insulation too. Here’s an example from a survey in Tadcaster, West Yorkshire. The post also introduces some other interesting associated defects.
We’d very much like to thank the following companies for their support over the past few years: Brick-Te Preservation obtain thermal imaging equipment and training via our valued suppliers Flir Systems and Thermographic Consultancy Limited.